
What is Technical Analysis?
Technical analysis is a method of analysing financial markets, such as stocks, forex, and commodities, by studying historical price and volume data to make predictions about future price movements. It is based on the idea that historical price patterns and trends can repeat themselves, and that these patterns can provide insights into the direction of future price movements.
Technical analysts use various tools and techniques, such as chart patterns, trend lines, moving averages, and technical indicators, to analyse price data and identify potential buying or selling opportunities. They believe that price movements are not random, but rather follow identifiable patterns that can be used to make informed trading decisions.
Some common principles of technical analysis include the belief that market prices reflect all available information, that historical price patterns tend to repeat themselves, and that trends in price movements can persist over time. Technical analysis is widely used by traders and investors to make trading decisions, but it is also a subject of debate among financial professionals, with some arguing that it is a valuable tool for predicting market movements, while others view it as less reliable and subject to human biases.
Technical Indicators: Technical indicators are mathematical calculations or statistical tools used by traders and investors in financial markets, such as stocks, forex, or commodities, to analyse past price data and identify potential future price movements. These indicators are plotted on price charts to provide insights into market trends, momentum, volatility, and other key factors that can help traders make informed trading decisions.
There are various types of technical indicators, including:
- Moving Average (MA): It is the average price of a stock or security over a certain period of time, usually calculated over 20, 50, or 200 days. It helps identify trends and potential entry or exit points.
- Relative Strength Index (RSI): It measures the speed and change of price movements, indicating whether a stock is overbought or oversold. RSI ranges from 0 to 100, with values below 30 indicating oversold conditions and values above 70 indicating overbought conditions.
- Bollinger Bands: They consist of three lines that show the volatility of a stock. The middle line is the MA, and the upper and lower lines represent the standard deviation from the middle line. Bollinger Bands help identify potential price breakouts or reversals.
- MACD (Moving Average Convergence Divergence): It is a momentum oscillator that shows the relationship between two moving averages. It consists of two lines – MACD line (the difference between the 12-day and 26-day exponential moving averages) and signal line (9-day exponential moving average of the MACD line). MACD helps identify trend reversals and divergences.
- Stochastic Oscillator: It compares a stock’s closing price to its price range over a certain period of time to determine its momentum. Stochastic Oscillator ranges from 0 to 100, with values above 80 indicating overbought conditions and values below 20 indicating oversold conditions.
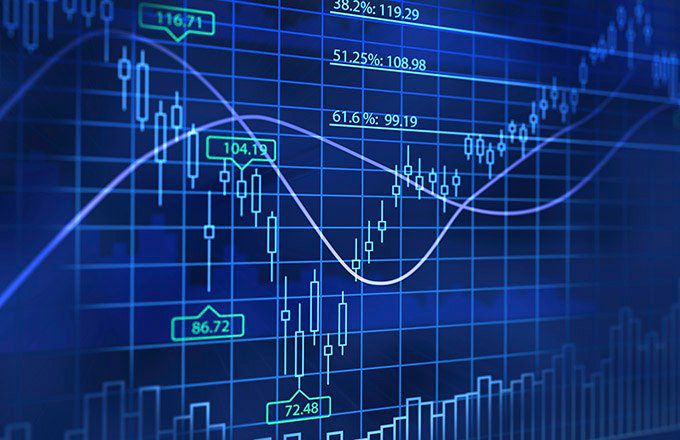
- Fibonacci Retracement: It uses Fibonacci ratios (38.2%, 50%, and 61.8%) to identify potential support and resistance levels. Traders use it to determine entry or exit points based on the stock’s price retracement levels.
- Volume: It measures the number of shares or contracts traded in a security. Changes in volume can indicate the strength or weakness of a price move, confirming or contradicting other technical indicators.
- On-Balance Volume (OBV): It uses volume to predict changes in stock price. OBV adds volume on up days and subtracts volume on down days, and the resulting line can help identify trend confirmations or divergences.
- Average Directional Index (ADX): It measures the strength of a trend and helps determine whether a stock is trending or ranging. ADX values above 25 indicate a strong trend, while values below 20 indicate a weak or ranging market.
These are just some of the many technical indicators used in stock market analysis. It’s important to note that no single indicator is foolproof, and traders often use multiple indicators in combination to make informed trading decisions. It’s also essential to consider other factors, such as fundamental analysis, market sentiment, and risk management, when making investment decisions.
Top of Form
Technical analysis for investment purposes: Here are some key aspects that technical analysis typically looks at for investment purposes:
- Price patterns: Technical analysts study various chart patterns, such as head and shoulders, double tops and bottoms, triangles, flags, and cup and handle patterns, among others, to identify potential trend reversals or continuation patterns. These patterns can provide insights into potential buying or selling opportunities.
- Trend analysis: Technical analysts analyse price trends to determine the direction of the market, whether it is in an uptrend (bullish), downtrend (bearish), or moving sideways (ranging). Trend lines, moving averages, and trend-following indicators, such as the MACD or ADX, are commonly used to identify and confirm trends.
- Support and resistance levels: Technical analysts identify support and resistance levels on price charts, which are price levels where buying or selling pressure has historically been significant. These levels can act as psychological barriers and influence future price movements. Breakouts above resistance or breakdowns below support levels can be used to identify potential buying or selling opportunities.
- Volume analysis: Technical analysts often analyse trading volume, which is the number of shares or contracts traded in a market, to assess the strength or weakness of price movements. An increase in volume during price rallies or declines can indicate the presence of buying or selling pressure, respectively, which may provide insights into potential trend reversals or continuations.
- Momentum indicators: Technical analysts use momentum indicators, such as the RSI, Stochastic Oscillator, or MACD, to assess the strength or weakness of price movements and identify potential overbought or oversold conditions. These indicators can help traders identify potential trend reversals or market turning points.
- Timeframes: Technical analysts often analyse price data on different timeframes, ranging from short-term intraday charts to longer-term daily, weekly, or monthly charts, to identify patterns or trends that may not be apparent on a single timeframe. Multiple timeframes are used to confirm or validate signals from technical indicators.
It’s important to note that technical analysis has its limitations, and it is not a guaranteed method for predicting future price movements. It should be used in conjunction with other forms of analysis and risk management techniques as part of a comprehensive investment strategy.
What is Chart pattern?
Chart patterns are visual representations of historical price movements in financial markets, typically depicted using candlestick or bar charts. They are used by traders and technical analysts to identify potential trends and reversals in price action. Chart patterns can provide insights into market sentiment, help traders make trading decisions, and identify potential entry or exit points for trades.
Some common types of chart patterns include:
- Head and Shoulders: This pattern indicates a reversal of an uptrend or downtrend and is characterized by three peaks, with the middle peak (the “head”) being higher than the other two (the “shoulders”). It suggests that the trend may be changing direction.
- Double Top and Double Bottom: These patterns indicate potential reversals of trend. The double top pattern consists of two peaks of similar height, indicating a possible trend reversal from an uptrend to a downtrend. The double bottom pattern consists of two troughs of similar depth, indicating a possible trend reversal from a downtrend to an uptrend.
- Triangles: Triangles are continuation patterns that suggest a pause in the prevailing trend before it resumes. They are characterized by converging trendlines that form either ascending, descending, or symmetrical patterns.
- Flags and Pennants: Flags and pennants are short-term continuation patterns that indicate a brief consolidation before the trend resumes. Flags are rectangular-shaped patterns that slope against the prevailing trend, while pennants are small symmetrical triangles that form after a strong price movement.
- Cup and Handle: This pattern indicates a bullish continuation. It resembles a teacup and handle shape, with a rounded bottom (the “cup”) followed by a small consolidation (the “handle”) before the trend resumes.
- Wedges: Wedges are continuation patterns that indicate a pause in the trend before it resumes. They can be either rising or falling wedges, and they are characterized by converging trendlines that slope in the opposite direction of the prevailing trend.
Major charts in technical analysis: Charts are commonly used in technical analysis to visually represent price data. Here are some types of charts commonly used in technical analysis:
- Line Chart: A line chart is the simplest type of chart that displays the closing prices of an asset over a specified period of time. It connects the closing prices with a line, allowing traders to identify trends and patterns.
- Bar Chart: A bar chart, also known as an OHLC (Open, High, Low, Close) chart, displays price data using vertical bars. Each bar represents a specific time period and shows the opening price, closing price, highest price (high), and lowest price (low) for that period.
- Candlestick Chart: A candlestick chart is similar to a bar chart as it also displays OHLC data, but it presents the information in a more visually appealing way. Each candlestick represents a specific time period and is composed of a body and wicks (also known as shadows). The body represents the range between the opening and closing prices, and the wicks represent the range between the high and low prices.
- Point and Figure Chart: A point and figure chart uses X’s and O’s to represent price movements. It filters out small price fluctuations and focuses on significant price changes. It is commonly used to identify support and resistance levels.
- Renko Chart: A Renko chart is a type of chart that represents price movements using bricks, with each brick representing a specific price range. The bricks are formed based on a predetermined price movement, rather than time, which filters out noise and focuses on significant price changes.
- Ichimoku Chart: The Ichimoku chart, also known as the Ichimoku Kinko Hyo, is a complex chart that displays multiple lines to provide a holistic view of price movements. It includes components such as the cloud, which represents support and resistance levels, and the tenkan-sen and kijun-sen lines, which indicate trend direction.
- Moving Average Chart: A moving average chart displays the average price of an asset over a specified period of time. Moving averages are widely used in technical analysis to identify trends and potential entry or exit points.
What are the tools of technical analysis?
Various tools are used in technical analysis to analyze and interpret market data. Some common tools of technical analysis include:
- Trendlines: Trendlines are lines drawn on a price chart to identify and analyze trends in price movements. They can be used to identify support and resistance levels, which are price levels where a security tends to find buying or selling pressure.
- Chart patterns: Chart patterns are recognizable formations on price charts that can indicate potential future price movements. Examples of chart patterns include head and shoulders, double tops, double bottoms, triangles, and flags.
- Moving averages: Moving averages are calculations that help smooth out price data and identify trends over a specific period of time. They can be simple moving averages (SMA) or exponential moving averages (EMA) and are used to identify potential entry and exit points based on crossovers and price interactions with the moving average lines.
- Technical indicators: Technical indicators are mathematical calculations applied to price data to provide insights into market trends and momentum. Examples of technical indicators include Relative Strength Index (RSI), Moving Average Convergence Divergence (MACD), and Bollinger Bands.
- Candlestick patterns: Candlestick patterns are visual representations of price movements in the form of candles on a chart. They can provide insights into market sentiment and potential trend reversals. Examples of candlestick patterns include doji, hammer, engulfing, and shooting star.
- Volume analysis: Volume analysis involves studying the volume of trading activity in a security to gain insights into market strength and potential price movements. High volume during price increases may indicate strong buying pressure, while high volume during price decreases may indicate strong selling pressure.
- Support and resistance levels: Support and resistance levels are price levels where a security tends to find buying or selling pressure. These levels are typically identified through historical price data and can be used to make trading decisions based on potential price reactions at these levels.
It’s important to note that technical analysis is subjective and relies on historical price data, and therefore may not always accurately predict future price movements. It’s often used in conjunction with other forms of analysis and risk management techniques to make informed trading decisions.
-

-

-

